How to use the performance overlay on the Steam Deck
Get framerate, battery life, and hardware monitoring data at a glance
Enabling the performance overlay on your Steam Deck takes but a moment, yet can deliver oodles of information on how your games are running. That makes it useful whether you simply want to know how much battery life to expect, or if you’re going full tweak mode on the Steam Deck’s hardware settings and need to scarf down as much performance data as possible.
Handily, the overlay isn’t buried in some dark corner of the SteamOS settings menus, nor obscured within Desktop Mode. It’s available, to turn on or switch off at any time, via the Quick Access menu – that’s the one which pops out from the right of the screen whenever you hit the three-dotted button just below the right trackpad. Read on for both how to enable the overlay, and more on each of its various detail levels; the more monitoring, the more your screen is obscured, so you might not want to have the most informative performance overlay running all the time.
How to use the performance overlay on the Steam Deck
Step 1: Press the Quick Access button on your Steam Deck, This will open the Quick Access menu on the right of the screen.
Step 2: Using the D-pad or left thumbstick, scroll down until you’re on the lighning bolt icon – this is the Performance menu.
Step 3: Press right and you’ll jump straight onto the performance overlay slider. Press A to select it, then move the slider to the number marker that presents your preferred amount of detail (more on these below). Then, just press the Quick Access button again (or repeatedly tap B) to exit the menu.
Easy as that, and you can always disable the performance overlay by returning to this slider and setting it to "Off".
Steam Deck performance overlay levels
Depending on what you actually want to monitor, and in how much detail, you’ll either want to flick between the different performance overlay levels or just choose one and stick with it. The four available modes will dynamically appear as you move the slider, so you can see immediate what each one entails, but for the sake of this being an informative good boy of a guide, here’s a quick overview of each:
Level 1 simply shows a framerate counter. This is my most-used mode, if I’m honest, as it provides a helpful indicator of whether a game’s visual quality settings are asking too much of the Steam Deck without taking up too much space on the screen. In games that can only run at 1280x720, not the Deck’s full 1280x800, it doesn’t even really infringe on the visible display area at all.
Level 2 adds a bunch more data points, including utilisation and power consumption figures for both the CPU and GPU, plus RAM and VRAM monitors, and a battery monitor that displays the remaining charge percentage as well as your estimated remaining playtime. This also doesn’t take up much screen real estate, given it sticks to a single horizontal line, though could still cover up HUD elements in certain games at 800p.
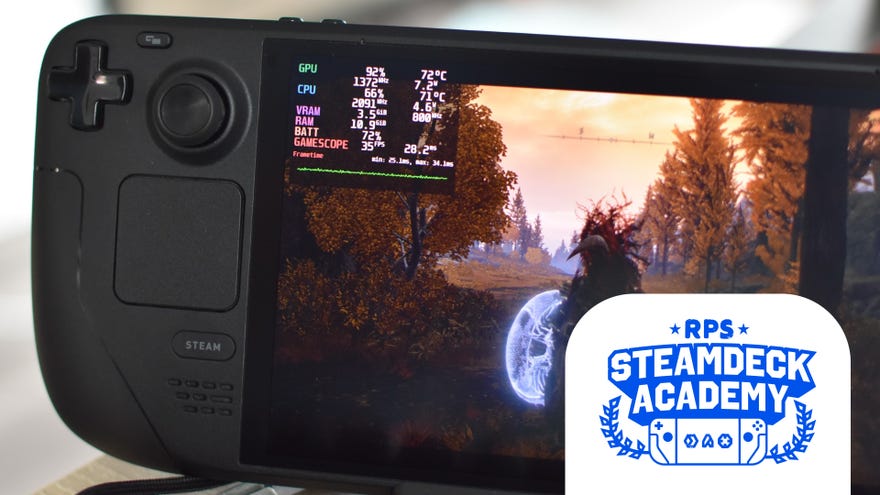
Level 3 removes some of the battery details, but replaces them with much more info on the CPU and GPU speeds and operating temperatures. The fact that it eats much of the top-left corner means this probably isn’t one to leave on while playing normally, but the data it provides will be very valuable if you’re using the Steam Deck’s advanced performance settings to tinker with TDP limits and clock speeds.
Level 4 features all of Level 3’s data and adds more still, such detailed frametime stats and CPU usage/speeds on a per-core basis. You also get back the battery details that Level 3 cuts from Level 2, all at the obvious cost of, y’know, covering up a quarter of the goddamn screen. For serious tuners (or the powerfully curious) only.

